A no-load RPM label cannot establish the operating speed. Compare the candidate’s loaded curve against both steady torque and acceleration demand. Pololu: interpreting brushed DC motor curves
This is a preliminary rigid-body model in SI units, using g = 9.80665 m/s² and a constant acceleration ramp. It does not simulate tire slip, breakaway friction, backlash, impacts, motor/gear rotor inertia or temperature. Include all moving mass; add a project-specific service margin separately.
How the calculator uses your data: Load & motion → Shaft torque / RPM → Candidate checks.
T = F × wheel radius. Torque is divided by the number of equally loaded motors.Point mass; add link inertia. Torque is divided by the number of equally loaded motors.No screw or scissor linkage. Torque is divided by the number of equally loaded motors.J = ½ m r². Torque is divided by the number of equally loaded motors.
Table 1. Load formulas and excluded effects
Mechanism
Total steady / added acceleration torque
Boundary
Wheel
m g (Crr cos θ + sin θ) r; add m (v/t) r; θ = atan(grade/100)
Total robot mass; uphill travel only; straight driving. No skid steering or traction check.
Arm
m g r; add m r² (ω/t)
Worst horizontal gravity load; equivalent point mass. Add each link and actuator inertia for a real arm.
Direct lift
m g r; add m (v/t) r
Direct vertical load on a constant-radius drum. Excludes pulley advantage and changing spool radius.
Intake
Measured resisting torque; add ½ m r² (ω/t)
Solid uniform roller only. Hollow rollers and intermittent object impacts require a different inertia/load model.
Per motor: divide load torque by motor count, then divide by ratio × gearbox efficiency for bare motor torque. Output speed is 60v/(2πr) for wheels/drums, or the entered RPM for arm/roller. Output power = torque × angular speed. Ideal reflected load inertia is J/i²; efficiency belongs in the torque/loss model, not the ideal inertia definition. Oriental Motor: increased loads and geared steppers
4. What the electrical screen can establish
For permanent-magnet brushed motors, the screen interpolates no-load and stall endpoints. At entered voltage V: n₀(V) ≈ n₀(12) V/12 and Tstall(V) ≈ Tstall(12) V/12. Available speed ≈ n₀(V)(1 − Tmotor/Tstall(V))/i. Current demand ≈ I₀(12) V/12 + [Istall(12) − I₀(12)] Tmotor/Tstall(12). These are approximations at fixed temperature. Pololu: interpreting brushed DC motor curves
Scaling no-load current with voltage is a screening assumption; brush friction, bearings and windage do not all scale this way. Use measured curves when checking a particular supply voltage.
Speed is checked under steady load and conservatively at peak acceleration torque at the end of the ramp. The candidate ratio is an input, not an automatically optimized answer. No negative speed is shown: a demand at or beyond stall is flagged as infeasible. A current-limited drive needs a separate torque check.
Table 2. What each result status means
Status
What it establishes
Next action
Candidate for validation
No mismatch in the entered brushed motor screen, before loaded battery sag.
At least one entered speed, torque or current constraint is exceeded.
Reduce demand, lengthen ramp, revise ratio or choose a larger motor/driver, then calculate again.
Load sizing only
BLDC or stepper output torque, RPM and power requirements only.
Ask for a controller-specific torque-speed curve, phase/bus currents and continuous duty limits.
A continuous torque input must come from a supplier rating under stated cooling and duty. A fixed fraction of stall torque does not establish thermal suitability. For cyclic duty, RMS torque is a screening aid; include powered holding torque and still check peak duration, speed-dependent losses and temperature.
5. Compare complete drive architectures
Table 3. Architecture choices and procurement tradeoffs
Option
Useful direction
Added cost / qualification work
Brushed + spur/planetary
Simple bidirectional control; compare loaded curves and packaging.
Brush inspection, EMC, driver cooling and gearbox life. No universal life-hour claim is available.
BLDC + gearbox
Consider for maintenance-sensitive or sustained operation.
Commutation/controller integration, low-speed feedback and phase-current calibration. Obtain a curve at your bus voltage.
Stepper + gearbox
Consider for indexed positioning when the torque-speed curve permits.
Holding heat, resonance and missed-step detection. Holding torque is not running torque.
Brushed + worm
Consider when right-angle packaging or reduction is useful.
These are qualitative purchasing tradeoffs, not a measured efficiency/lifespan ranking. Compare total drive cost: motor, gearhead, encoder, controller, wiring, cooling, brake, validation and maintenance.
When multiple 12V robot motors share locomotion, the mechanical torque distribution depends on contact geometry and control. The calculator divides total straight-line rolling, uphill and acceleration torque equally between motors; it does not model turning or unequal loading. Validate that assumption for the actual chassis before selecting hardware.
Straight thrust can be divided equally only when load sharing is justified. Skid-steer turning and Mecanum motion require additional geometry, contact and control models; the calculator does not evaluate them. Scroll the diagram horizontally on smaller screens.
Table 4. Multi-motor sizing boundaries and required checks
Measure turning and breakaway demand as well as forward travel; verify traction and motor thermal duty.
4WD Skid-Steer (SSWMR)
4 motors; forward T = 0.25 × F_tot × r
Lateral scrub depends on wheelbase, track, contact loads, tire and floor conditions; no universal multiplier is established here.
Measure pivot-turn torque/current at the intended payload and floor, or use a validated contact model. Forward sizing alone is incomplete.
4-Wheel Mecanum Omnidirectional
4 motors; map chassis translation and rotation into individual wheel speeds.
Roller losses, contact forces and combined motion are not captured by a universal √2 torque factor or fixed efficiency.
Use wheel-location-specific kinematics, then verify each wheel’s load and duty. Obtain wheel/roller data and measure worst-case current.
Dual Synchronized Joint (Arm/Elevator)
2 motors sharing one shaft or leadscrew
Backlash, stiffness and controller mismatch can prevent equal sharing; no fixed load split is guaranteed.
Assess mechanical coupling and coordinated control. Measure each motor current and include an unequal-sharing load case.
The straight-line expressions above are derived from T = F × r/N for equally loaded motors, not a turning model. WPILib documents Mecanum wheel-specific velocity mapping from chassis motion and wheel locations; it does not establish torque margins or roller efficiency.WPILib: Mecanum drive kinematics Verify repeated turns and combined translation/ rotation against measured current and temperature.
7. Read a real datasheet without mixing shaft references
Separate mechanical limits can bind before theoretical stall. Check the selected model.
Source: Pololu: 12V 37D metal gearmotors. Conversion: 1 kg·cm = 0.0980665 N·m. This example is a spur/helical gear family, not a planetary benchmark. Its values are separate from the hypothetical calculator defaults; continuous motor torque and efficiency remain to be confirmed.
8. Shared bus sizing for multiple 12V robot motors: startup sag, wiring and regeneration
Startup load path: Motor current → Shared I × R drop → Check undervoltage.
Table 6. Reproducible sag scenarios, not battery chemistry measurements
Assumed shared resistance
Assumed 20 A total draw
Meaning at 12 V before sag
15 mΩ
ΔV = 0.30 V
11.70 V in the uncoupled I × R scenario
35 mΩ
ΔV = 0.70 V
11.30 V in the same scenario
100 mΩ
ΔV = 2.00 V
10.00 V; compare with actual controller and regulator limits
When multiple 12V robot motors operate from a single battery or DC distribution bus, startup inrush currents sum across all active channels. Startup sag uses the scaled full-voltage stall current of all motors starting together and your shared battery/harness resistance. It omits inductance, current limiting, state of charge, temperature and changing back-EMF; the current and voltage are not solved together. Measure actual transients. Chemistry labels alone do not determine pack resistance or cutoff.
Calculated wiring illustration, not measured hardware: ideal 12.0 V source, four equal 5 A loads, and no source sag. Separate feeds each have 40 mΩ loop resistance, giving 11.8 V. Chained segments each have 20 mΩ loop resistance; downstream voltages are 11.6, 11.3, 11.1 and 11.0 V. Returns and branch protection are omitted. The logic supply requires its own validated regulator; topology alone gives no isolation or brownout guarantee.
Table 7. DC bus distribution architectures: Star vs daisy-chain electrical comparison
Architecture
Conductor length & mass
Terminal voltage balance
Brownout & logic isolation
Separate branch feeds
Independent paired runs from a distribution point; size each branch and its protection for actual load.
Each branch drop is I_branch × R_loop. Equal terminal voltage requires equal current and resistance; shared source sag remains.
A separate regulator can reduce shared wiring disturbance. Check input range, grounding, noise and any required galvanic isolation.
Chained shared segments
Segments carry the sum of downstream currents; check connectors, conductor heating and protection.
Calculate each segment drop from its actual current and loop resistance. No fixed voltage drop follows from topology alone.
Compare the lowest measured voltage with each driver and regulator’s own undervoltage limit; a reset threshold is device-specific.
Soft-start ramp profiling
Longer ramps may reduce acceleration torque; current limiting is a separate controller function.
No universal ramp time guarantees a current limit or prevents stalls. Measure current during startup and obstruction.
Check driver current-limit behavior, BMS trip curves and required acceleration together. Use rated protection.
For a wire-only calculation, ΔV = I × resistance per metre × round-trip length. For example, an assumed 13.2 mΩ/m conductor, 3 m total loop and 10 A produces 0.396 V drop before connector losses. Choose ampacity using installation, insulation and temperature data; this example does not certify a wire gauge or a universal 5% requirement.
Deceleration energy path: Load kinetic energy → DC bus regeneration → Rated energy sink.
For an ideal capacitor absorbing E joules, C ≥ 2E/(Vmax² − Vstart²). Absorbing 5 J from 12 V to 16 V needs about 0.0893 F (89,300 µF), before losses and margins. A generic 4,700 µF part would store only 0.263 J across that voltage rise. Determine the sink and TVS pulse ratings from the actual driver and BMS. Texas Instruments SSZTBS1: use bulk capacitance
9. Mobile robot safety standards, stopping distance and braking verification
For driverless industrial trucks, ISO 3691-4:2023 covers safety requirements and verification; its public scope includes AGVs and AMRs. ISO 3691-4:2023: scope and publication status Scope checked on 11 November 2026; confirm the applicable edition, machine category and jurisdiction for your project. The public abstract does not support clause-level claims, a universal brake prescription or a protective-field setting.
Conceptual distance budget: motion during response, motion during constant deceleration, and an assumed extra allowance. This is not a standard-prescribed protective field. Actual field design needs the device instructions, applicable standards and measured stopping tests.
Table 8. Braking approaches and verification boundaries
Deceleration method
Stopping dynamics & energy sink
Power-loss behavior
Standards & compliance boundary
Regenerative / dynamic electrical braking
Regeneration returns energy to the bus; dynamic braking dissipates energy in the motor/drive path. Follow the actual drive’s braking modes.
Behavior depends on drive state, wiring and energy sink. Do not assume electrical braking remains available after power loss.
Validate stopping and bus voltage under load, faults and BMS disconnect. This page assigns no safety category.
Spring-applied electromechanical brake
Power releases the brake; springs apply it after its specified response delay when release power is removed.
Holding and stopping depend on rated torque, wear, response time, wiring and the control circuit.
Select and test for the actual holding or dynamic stopping duty; a power-off brake alone does not certify a safety function.
Worm gear self-locking
Backdriving depends on gear geometry, efficiency and operating conditions.
Do not infer a reliable stop or holding function from ratio alone.
SEW-EURODRIVE excludes self-locking as the sole hoist safety function. That is a manufacturer statement for that scope, not a clause-level claim about every mobile robot.SEW-EURODRIVE: self-locking, edition 02/2025
Illustrative constant-deceleration distance: S = v × t_response + v²/(2a) + C. With assumed v = 1.0 m/s, total response delay = 0.2 s, a = 1.2 m/s² and allowance C = 0.25 m, S = 0.20 + 0.417 + 0.25 ≈ 0.87 m. These assumed inputs are not standard-prescribed values and 0.87 m is not a certified minimum protective zone. Measure worst-case loaded stopping distance, including floor/grade, brake delay, sensor uncertainty and faults; use the protective device’s instructions and a qualified machine safety assessment.
10. Gearhead radial loading, cantilevered wheel axles and bearing life
Mobile robot drivetrains place direct vertical and shock loads on the gearbox output shaft. Sizing solely for motor torque and RPM often leads to mechanical failure if overhung radial loads (F_r) exceed bearing fatigue ratings.
Direct mounting applies a moment F_r × L at the shaft support. External bearings can redirect wheel loads to the chassis, but alignment, coupling stiffness and bearing reactions still need checking. Neither layout establishes a universal operating life.
Table 9. Gearhead radial loading and bearing fatigue life (L10h)
Axle mounting layout
Shaft bending moment
Bearing fatigue life (L10h)
Recommended application boundary
Cantilevered direct hub
Applied shaft-support moment M = F_r × overhang distance L; bearing reactions depend on the support geometry.
Unknown without bearing data, equivalent load, speed, lubrication and duty.
Use only within the selected gearhead’s radial/axial load limits at the stated overhang; no universal mass or speed cutoff.
Straddle dual pillow block
External bearings can carry wheel reactions; misalignment and a rigid coupling can still load the gearhead.
Unknown until the bearing arrangement and duty are analyzed; external supports do not guarantee a service life.
Consider where direct-shaft ratings are inadequate. Specify bearing spacing, alignment and a suitable coupling.
Planetary vs Spur wheel drive
Internal tooth load distribution differs; neither architecture eliminates shaft or bearing bending.
Unknown from gear type alone. Compare actual continuous/peak torque, bearing ratings and peak duration.
Select by published unit ratings, packaging and measured duty; no universal shock-load percentage applies.
SKF describes ISO 281 basic rating life at 90% reliability: L10h = (C/P)^p × 10^6/(60n), with C and equivalent dynamic load P in the same force units, n in RPM, p = 3 for ball bearings and 10/3 for roller bearings. SKF: bearing selection and basic rating life, pp. 33–35 This is a bearing fatigue estimate under its stated conditions, not gearbox or fleet service life. Illustratively, doubling a constant equivalent P reduces ball-bearing basic life to one eighth; a brief impact is not equivalent to doubling the entire duty-cycle load. C, P and duty are unknown for an unspecified candidate; request the supplier’s load assessment.
11. Worked scenarios you can reproduce
Calculated illustrations with no service factor, not customer installations or measured reliability results. Choose the corresponding example in the calculator to inspect its inputs.
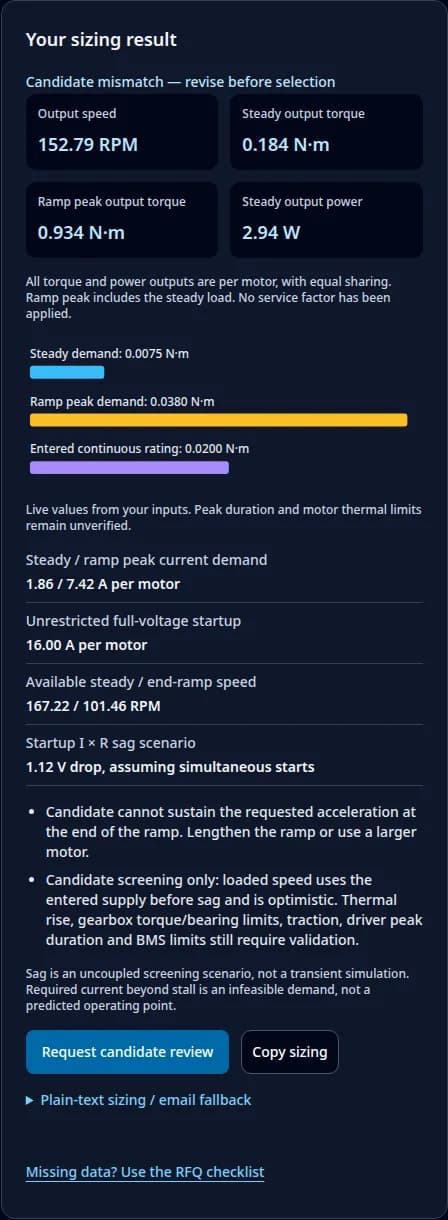
Software run captured on 11 November 2026 using the 15 kg wheel example: 50 mm radius, 0.8 m/s, 0.4 s ramp, two motors, 3% grade and 0.02 rolling resistance. The ramp exceeds the candidate’s loaded-speed capability. Site contact overlays are hidden in this illustration. This is not a physical motor test or customer installation.All inputs used in the captured wheel example
Select Wheel drive and Brushed DC + planetary / spur, then use these inputs. Motor and driver values are hypothetical assumptions, separate from the Pololu manufacturer example above. No service factor is included.
Total moving mass (kg)
15
Wheel / lever / spool radius (mm)
50
Target speed (m/s)
0.8
Acceleration time (s)
0.4
Motors sharing this load
2
Uphill grade (%)
3
Rolling resistance coefficient
0.02
Candidate reduction ratio (:1)
30
Assumed gearbox efficiency (%)
82
Supply voltage before sag (V)
12
Battery + shared harness resistance (mΩ)
35
Bare motor no-load speed at 12V (RPM)
5500
Bare motor no-load current at 12V (A)
0.5
Bare motor stall torque at 12V (N·m)
0.085
Bare motor stall current at 12V (A)
16
Datasheet continuous bare motor torque (N·m)
0.02
Driver continuous current per motor (A)
8
Driver peak current per motor (A)
18
15 kg wheel base
Mass 15 kg; radius 50 mm; 2 motor(s); target 0.8 m/s; ramp 0.4 s. Grade 3%; Crr 0.02.
Per motor: 152.79 RPM; 0.184 N·m steady; 0.934 N·m including acceleration.
Candidate mismatch with the example motor data.
Candidate cannot sustain the requested acceleration at the end of the ramp. Lengthen the ramp or use a larger motor.
Next: confirm traction, skid-turning torque, gearbox limits and a loaded thermal test.
5 kg arm joint
Mass 5 kg; radius 250 mm; 1 motor(s); target 12 RPM; ramp 0.4 s.
Per motor: 12.00 RPM; 12.258 N·m steady; 13.240 N·m including acceleration.
Load sizing only; no motor fit is established.
Load sizing only: obtain the motor/controller torque-speed curve at this voltage. Phase current, bus current and thermal ratings are not inferred from brushed DC stall data.
Next: include link inertia and obtain a BLDC/controller curve and brake assessment.
25 kg direct winch
Mass 25 kg; radius 20 mm; 1 motor(s); target 0.05 m/s; ramp 0.5 s.
Per motor: 23.87 RPM; 4.903 N·m steady; 4.953 N·m including acceleration.
Candidate mismatch with the example motor data.
Required steady motor torque exceeds the entered continuous rating. Select a higher continuous rating or reduce the load.
Next: confirm drum geometry, gearbox ratings and a separately validated holding/braking system.
2 kg solid roller
Mass 2 kg; radius 30 mm; 1 motor(s); target 600 RPM; ramp 0.15 s.
Per motor: 600.00 RPM; 0.150 N·m steady; 0.527 N·m including acceleration.
Candidate mismatch with the example motor data.
Required steady motor torque exceeds the entered continuous rating. Select a higher continuous rating or reduce the load.
Next: measure roller drag and object-impact loads; confirm roller inertia, gearbox limits and a loaded thermal test.
12. Risks and the next verification step
Table 10. Known limits and practical mitigations
Risk
What remains unknown
Minimum next step
Misuse: thermal qualification
Winding rise, enclosure cooling and continuous duty at actual speed.
Obtain supplier limits; run an instrumented duty-cycle test with overtemperature protection.
Misuse: gravity holding
Power-loss stopping and retention under maximum load.
Scissor/screw geometry, skid steering, linkage inertia or roller impacts.
Use a mechanism-specific model; measure breakaway and peak loads.
Cost risk
Gearhead life, radial loads, encoder, driver, brake and maintenance cost.
Request a system quote and dimensional drawing, not a bare motor price.
Voltage architecture
Minimum loaded voltage, wire temperature and regeneration limits.
Compare 12V with 24V at the same output duty. Mass alone does not impose a voltage threshold.
At equal electrical input power, doubling voltage halves current; for unchanged resistance, I²R wire loss becomes one quarter. This does not by itself establish total system efficiency, a cable size or suitability for a given robot.
Send per-motor output RPM, steady/ramp torque, service factor, duty profile and complete moving mass. Include a drawing showing wheel/spool radius, shaft overhang and bearing support.
State minimum/maximum loaded voltage, driver continuous/peak current and duration, current-limit settings, BMS behavior, and required power-off behavior.
Ask for loaded curves, continuous ratings with thermal conditions, gearbox torque and bearing limits, encoder count conventions, backlash, lead time, quantity and maintenance plan.
Test acceleration, reverse/braking, voltage/current transients and temperatures at the real duty cycle. Review applicable safety standards for the complete machine and jurisdiction; this page establishes no compliance claim.
Primary sources accessed on . Manufacturer ratings are model-specific and may change. Example calculations are derived from the displayed assumptions; no independent fleet, lifespan, certification or laboratory claims are made.
Manufacturer no-load and extrapolated stall data, with separate gearbox limits. Not a supplier endorsement or a matched candidate.
Frequently asked selection questions
Sizing and model boundaries
What does this 12V robot motor calculator calculate?
It estimates output RPM, steady and acceleration torque, bare motor torque through a candidate ratio, and steady output power per motor. Brushed DC modes add an approximate loaded-speed and current screen. It does not qualify a motor thermally or certify a machine.
Should I enter payload mass or total robot mass?
Wheel mode needs the entire moving robot mass, including payload and battery. Arm mode uses an equivalent point mass at the stated reach and worst horizontal gravity load; add real link inertia separately. Lift mode uses the suspended mass on a direct drum. Intake mode assumes a uniform solid roller and measured resisting torque.
Does the tool choose an optimal planetary gear ratio?
No. Enter an actual candidate reduction ratio and gearbox efficiency. The screen checks whether the brushed motor can deliver the requested loaded speed at that ratio. Review available ratios, tooth and bearing limits with the supplier.
Can I use this for scissor lifts, screws or skid-steer robots?
Those mechanisms need additional geometry or friction models. Lift mode represents only a constant-radius direct drum. Wheel mode represents straight uphill travel and omits skid-turning resistance. Use measured peak loads or a mechanism-specific calculation before selecting hardware.
What safety factor is already included?
None. Results reflect the entered idealized load and constant acceleration ramp. Select a service factor from measured load uncertainty, shocks, duty cycle and the consequences of failure; there is no universal factor that qualifies every robot.
How do drivetrains size and balance multiple 12V robot motors?
The tool divides the selected mechanism’s total load torque equally across the entered motor count. Wheel mode includes straight-line rolling, grade and acceleration demand; it omits skid-turning and Mecanum contact forces. Equal sharing is an assumption, not a controller function. Measure individual motor currents and worst-case turning loads, and verify combined startup demand against the shared battery, wiring, driver and BMS limits.
Motor and controller selection
Why is stall torque different from continuous torque?
Stall torque describes a zero-speed endpoint. Continuous torque is a supplier rating under defined thermal and duty conditions. A fraction of stall torque cannot establish continuous capability. The calculator asks for a separate continuous rating; no-load RPM also does not establish loaded speed.
Can the same current model be used for BLDC and stepper motors?
No. This tool reports load requirements only for those modes. Ask for a controller-specific torque-speed curve at the intended voltage, phase-current limits, bus current and thermal limits. Stepper holding torque is not the torque available while running.
Which shaft do the motor inputs describe?
Enter bare motor no-load speed, stall torque, stall current and continuous torque, with a separate gearbox ratio and efficiency. Do not enter gearmotor output torque as bare motor torque or apply reduction twice. The datasheet example in the report shows the distinction.
What does a candidate result mean?
It means the entered brushed motor data did not trigger a model mismatch before loaded supply sag. Gearbox ratings, motor heating, traction, controller peak duration and the battery BMS remain unverified. Request a supplier candidate and test the real duty cycle.
Power, holding and next steps
How is battery voltage sag estimated?
The screen multiplies all motors’ scaled full-voltage stall current by entered shared battery and harness resistance. It is an uncoupled startup scenario, not a transient simulation or a chemistry-specific prediction. If the drop reaches the supply voltage, no terminal voltage is predicted. Measure actual startup and compare device undervoltage limits.
Does a worm gearbox remove the need for a holding brake?
No. Backdriving depends on the gear unit, lubrication, wear and vibration. SEW-EURODRIVE states that worm self-locking is not permitted as the sole safety function for hoists. A gravity-loaded mechanism needs a separately assessed and validated holding/braking system; see the linked source in the report.
Is a 4,700 µF capacitor sufficient for regenerative braking?
There is no universal value. Determine returned kinetic energy, permitted bus voltage rise, driver ratings and the energy sink. In an ideal capacitor-only example, absorbing 5 J between 12 V and 16 V requires about 89,300 µF, before margins. See the TI reference and energy calculation in the report.
When should I compare 12V with 24V?
Compare them when cable losses, current handling, loaded voltage or sustained power become limiting. At equal electrical input power, 24V uses half the current of 12V and one quarter the I²R wire loss for unchanged resistance. Robot mass alone does not define a mandatory upgrade threshold.
What if I do not know the motor parameters?
Use load sizing only with BLDC or stepper mode to obtain the output requirements, or follow the supplier checklist without claiming an electrical fit. Ask for bare motor curves, continuous ratings, gearbox limits, driver peak duration and voltage range. Hypothetical defaults are examples, not a product recommendation.
How can I use the result if email or clipboard access fails?
Open the plain-text sizing below the result, select its text and paste it into your preferred inquiry channel. The summary includes active inputs, architecture, per-motor load requirements and unresolved checks; quantity and schedule are left for you to supply.
Can several 12V robot motors run from one battery?
Yes, if the battery, BMS, wiring, protection and drivers support the combined duty and startup current. For identical brushed motors starting together without current limiting, this tool’s full-voltage scenario sums per-motor stall current; actual current and voltage interact. Separate branch feeds do not remove shared battery sag. Measure voltage at every driver and logic regulator, check their own operating limits, and provide a rated path for braking energy.